Arduino OLED Light Sensor Graph Project
Level 62 · Draw It · 35 minutes
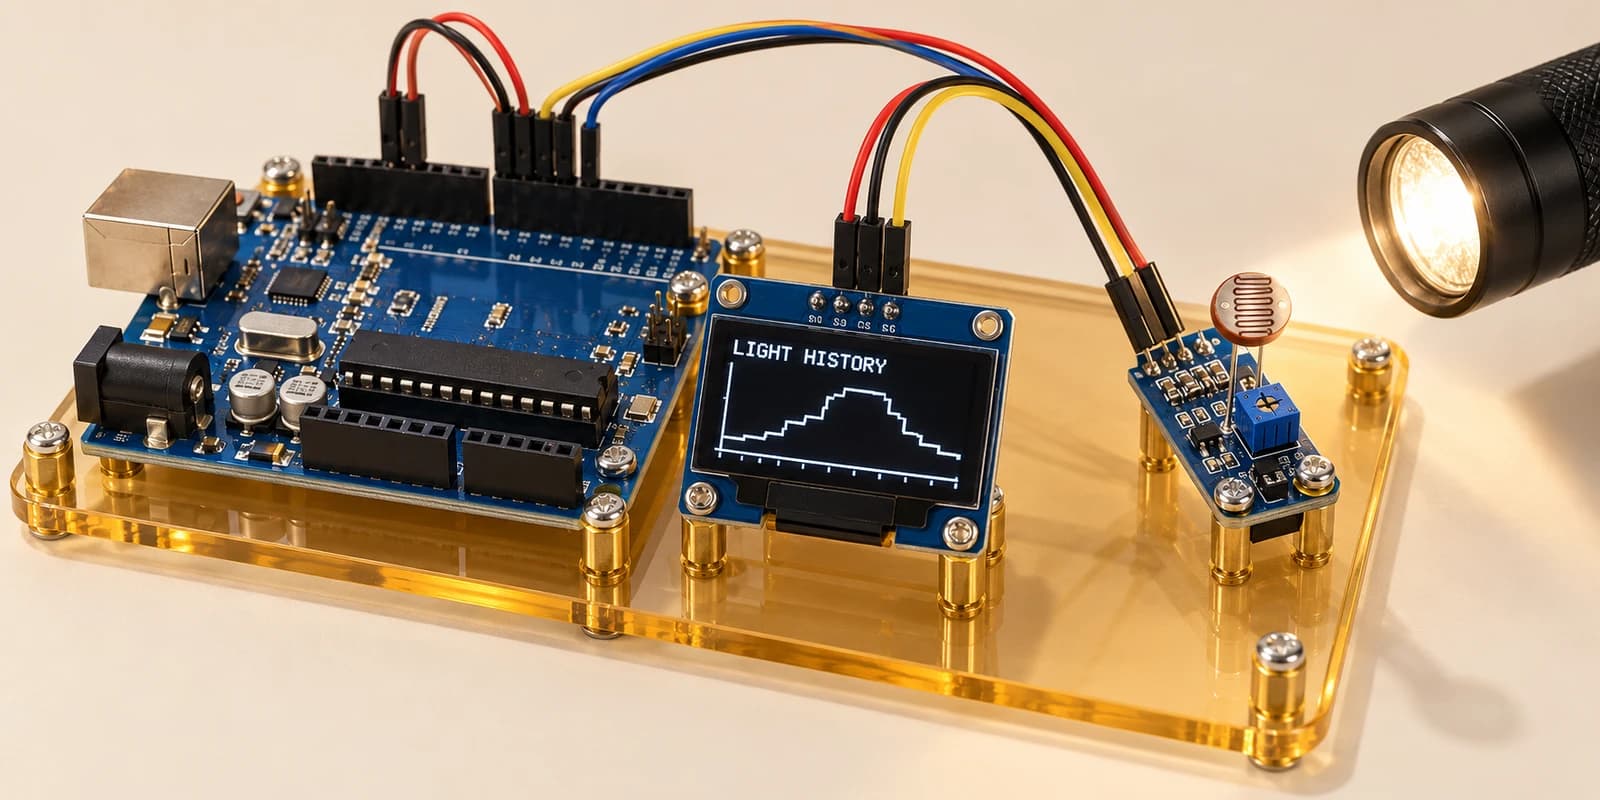
Make a tiny light recorder: brighten and darken a sensor and watch its recent history scroll across an OLED.
Preview the project free; a course seat is required to run and submit. No hardware kit needed.
Your project challenge
Record light on A0 every 100 ms. Keep 64 readings, oldest on the left. Draw each as a 2×2 dot: x=index×2, y=map(value,0,1023,62,16). Clear and redraw the graph, then call display(). Change the light slider: bright moves upward; old readings scroll left.
Components you’ll use
- Arduino Uno
- OLED Display (128×64)
- LDR (Light-Dependent Resistor)
What you’ll build
A tiny light-history recorder. Follow the seven wiring steps and start the simulation. Move the light slider slowly, then quickly. Watch the newest dot on the right and the older readings moving left.
How it works
The sensor’s AO pin sends an analog signal to A0. This simulation maps darkness to zero and full brightness to 1023. The OLED shows the most recent 64 samples, about 6.4 seconds of history.
The key idea
Every 100 milliseconds, move the stored readings one place left and add the newest at the end. Draw a 2×2 dot for each: x=index×2; y=map(value,0,1023,62,16). Smaller y means higher on the screen.
⚠ Watch out
Clear the drawing buffer, not the saved readings. Call display after drawing. Use millis for sampling so drawing time does not slow the sample rate. This is a slow light recorder, not an instrument for measuring fast electrical signals.
Try it: hold dark, switch bright, then return to dark. The raised section should travel across the screen.
The interactive editor includes the wiring guide, code editor and simulation controls.