Arduino Sound Sensor LED Bar Graph
Level 23 · Level 23 — How Loud · 25 minutes
Mapping a continuous range onto ten LEDs, so a number becomes a bar you can read at a glance.
Preview the project free; a course seat is required to run and submit. No hardware kit needed.
Your project challenge
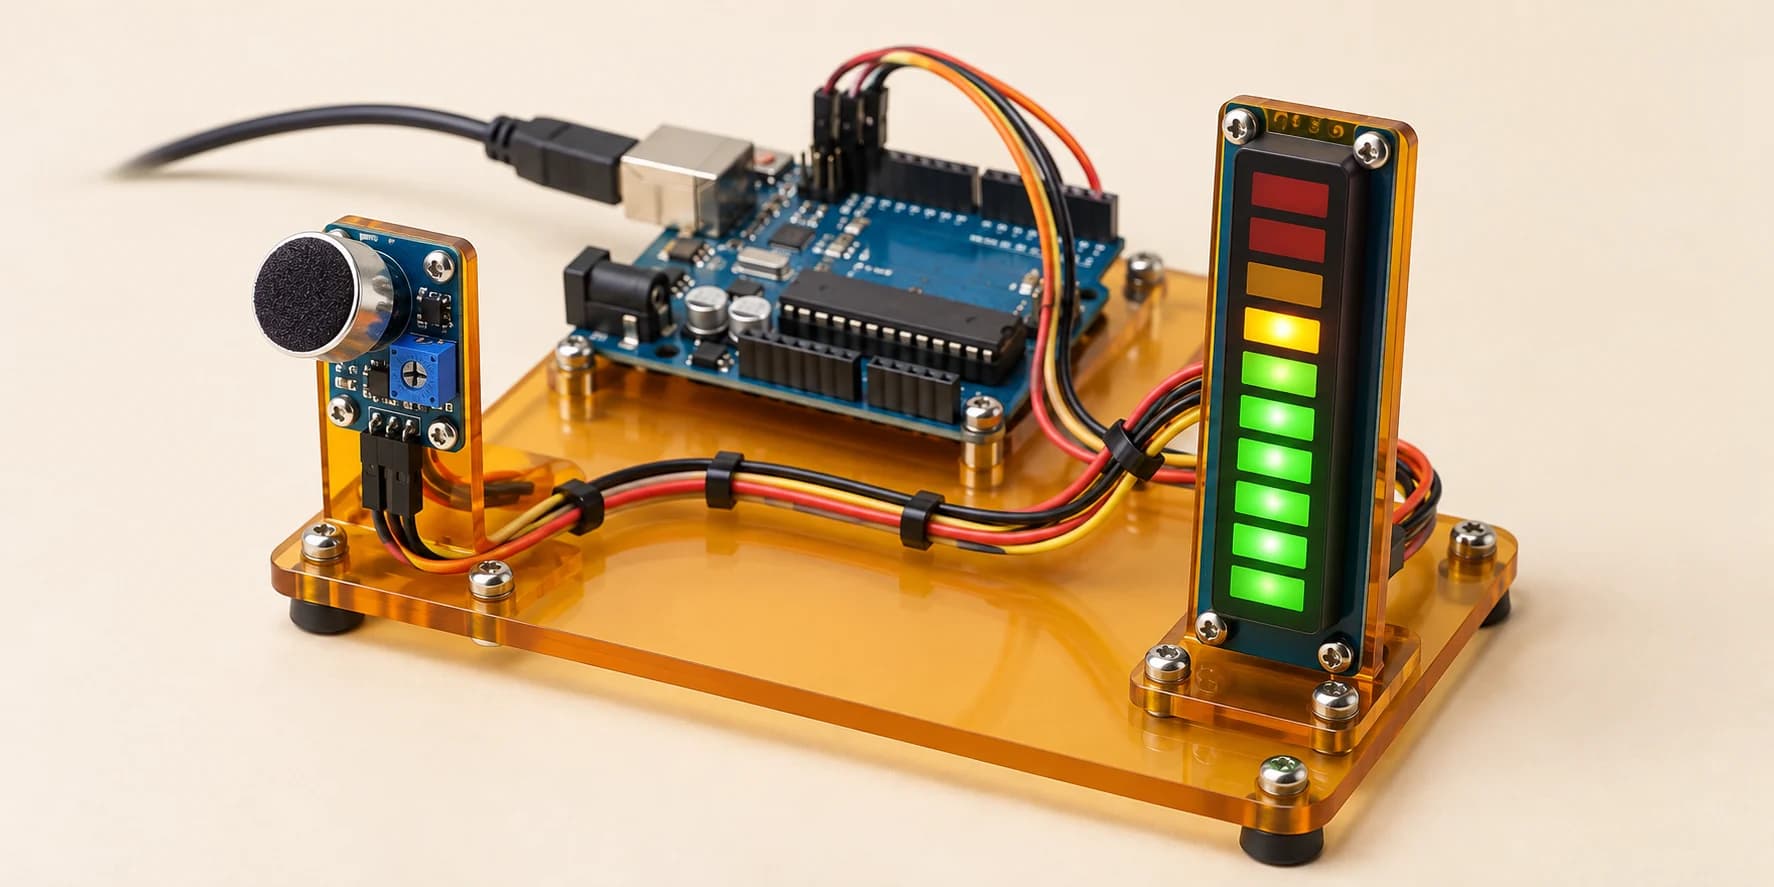
Turn loudness into a bar of light. Wire it up: - Sound sensor: VCC to 5V, GND to GND, AOUT to A0 - Bar graph anodes: A1-A10 to D2-D11 (A1 is the bottom) - Bar graph cathodes: all ten, C1-C10, to GND Then read the sensor, map 0-1023 onto 0-10 LEDs, and light that many from the bottom up.
Components you’ll use
- Arduino Uno
- Sound Sensor
- LED Bar Graph (10 segments)
What you’ll build
A volume meter: ten LEDs, taller as the room gets louder. Glance at the signal bars on a phone. A height is something the eye measures without being asked.
How it works
- AOUT is a voltage that rises with the sound. A0 reads it as 0 to 1023.
- Ten LEDs share nothing, so they cost ten of the eighteen pins the Uno can spare: D2 to D11.
- A1 goes to D2, the bottom of the bar; A10 to D11, the top. Position is height.
The key idea
Rescale the range you have onto the range you can show.
map(level, 0, 1023, 0, 10)
A reading of 768 is 768 × 10 / 1023 = 7 LEDs. Multiply first, or 768 / 1023 is 0. Do it once and map() is never magic.
⚠ Watch out
Light every LED below the level, not just the top one. A bar is the first seven, counting up from D2. LEDs 1, 3, 4, 6, 7, 9 and 10 is seven lights and no meaning at all.
A missing cathode is the fault that looks like nothing: that LED never lights while its nine neighbours behave.
The interactive editor includes the wiring guide, code editor and simulation controls.